Recently, I had to troubleshoot a case of performance degradation on an Azure VM. The key symptom was high memory pressure, which in Azure means the system is under heavy strain to fulfill memory requests — often leading to lag, paging, and slow performance.
To get to the root cause, we used Azure Performance Diagnostics (PerfInsights) — a powerful and easy-to-use troubleshooting tool. Here’s how you can install and use it from the Azure Portal, without needing to log in to the VM.
How to Install Azure Performance Diagnostics
You don’t need RDP or any script — you can install the tool directly from the Azure Portal.
-
Go to the VM in the Azure Portal
-
In the left-hand menu, under Settings, click Extensions + applications
-
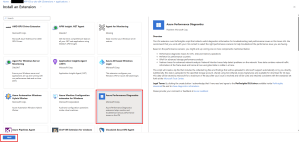
Click + Add
-
Search for and select Azure Performance Diagnostics
-
Click Next, then configure the storage account and scenario:
-
Storage Account Name & Key: Required for storing diagnostic results
-
Performance Scenario: Choose e.g. Slow VM analysis
-
Trace Duration: 5–10 minutes is usually enough
-
-
Click Review + Create to begin the diagnostics
How to View the Results
Once diagnostics complete:
-
Go back to Extensions + applications
-
Select AzurePerformanceDiagnostics
-
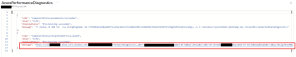
Click View detailed status on the right-hand blade
-
Inside the JSON output, find the SAS URL — it links to the diagnostic ZIP file
-
Download and extract the ZIP. Open the file:
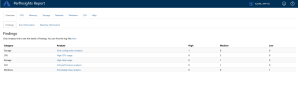
What You’ll See in the Report
The report is interactive and contains tabs for:
-
CPU, Memory, Disk, Network, CLR, and Windows
-
A Findings section summarising issues with severity
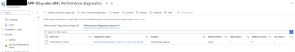
Alternative Way to View the Report
You can also return to Diagnose and solve problems > Performance diagnostics, and download the report directly from there if the extension was run through the portal.
Final Thoughts
PerfInsights is a must-have tool when dealing with VM slowness, unexplained spikes in CPU/memory usage, or high disk I/O. It helps:
-
Pinpoint which processes are consuming memory or CPU
-
Validate if your current VM size is adequate
-
Save hours of guesswork during incident response
If you’re troubleshooting a sluggish VM — start with Azure Performance Diagnostics. You’ll be surprised how much easier root cause analysis becomes.

